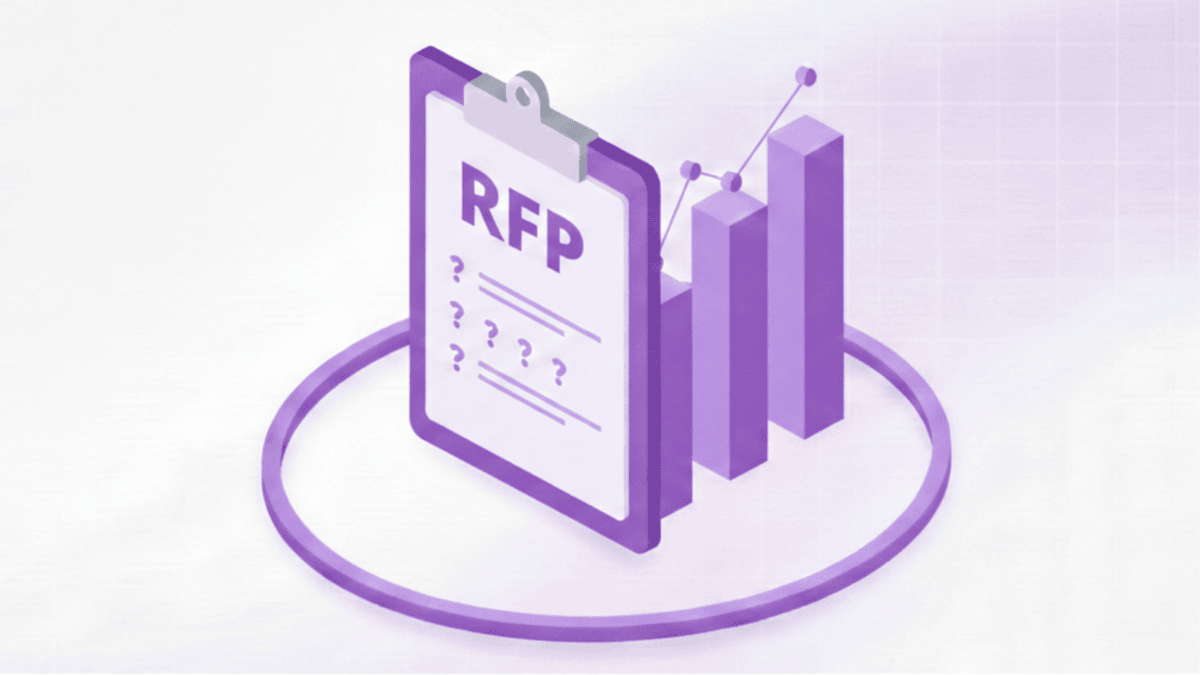


Selecting the right data visualization tool shapes how your organization makes decisions for years to come. Yet many teams rush into procurement with generic RFPs that fail to uncover whether vendors can truly handle their specific visualization challenges, data volumes, and user needs. The result? Implementations that disappoint, budgets that spiral, and teams that revert to spreadsheets because the expensive tool doesn't actually work for their workflows.
A well-crafted RFP for data visualization tools prevents these failures. It forces you to clarify exactly what you need, helps vendors understand your requirements, and creates an objective framework for comparing capabilities. More importantly, it surfaces deal-breakers early, before you've invested months in implementation, by asking the right questions about performance, scalability, user adoption, and total cost of ownership.
This guide walks through the essential elements of data visualization RFPs, the critical questions that reveal true vendor capabilities, and the evaluation strategies that lead to successful tool selection. Whether you're replacing an existing platform or implementing your first enterprise visualization solution, these insights help you draft RFPs that deliver the information you actually need to make confident decisions.
Why data visualization RFPs need a specialized approach
Generic technology RFPs fall short for data visualization procurement because they don't address the unique tensions between power-user needs and business-user accessibility, technical performance and visual aesthetics, and embedded analytics and standalone reporting. Data visualization sits at the intersection of technology, design, and business intelligence, requiring evaluation frameworks that balance all three dimensions.
Data visualization tools differ fundamentally from other enterprise software in several ways:
- User diversity matters more: A single tool must serve everyone from executives viewing dashboards on mobile devices to data analysts building complex visualizations with custom SQL. Most enterprise software targets a relatively homogeneous user group; visualization tools must accommodate dramatically different skill levels and use cases within the same deployment.
- Performance impacts adoption directly: When dashboards load slowly, or visualizations lag during filtering, users abandon the tool regardless of its features. Unlike CRM or ERP systems, where users tolerate performance issues because they must use the tool, visualization tools face constant competition from Excel and manual reporting when they don't deliver instant insights.
- Deployment models vary widely: Organizations need embedded analytics in customer portals, standalone dashboards for internal teams, pixel-perfect reports for regulatory compliance, and ad-hoc exploration for analysts. Your RFP must verify that vendors support all the deployment patterns you require, not just the most common use case.
These factors mean your RFP needs sections that traditional technology RFPs don't include: visual design evaluation criteria, performance testing requirements with your actual data volumes, user persona-based capability assessment, and deployment flexibility verification. Generic feature checklists miss the nuances that determine whether a visualization tool actually works for your organization.
Core sections every data visualization RFP needs
Comprehensive data visualization RFPs balance providing enough context for vendors to propose appropriate solutions while maintaining a structure that enables objective comparison. These sections form the foundation of effective evaluation.
Company context and visualization strategy
Begin by helping vendors understand not just what you do, but how you currently use data and what you hope to achieve with better visualization capabilities. This context shapes their proposals significantly.
- Describe your current state candidly: If you're struggling with Excel-based reporting that can't keep pace with business growth, say so. If executives complain they can't get timely answers to simple questions, include that pain point. If your data team spends 60% of their time creating one-off reports rather than analysis, quantify that waste.
- Detail your visualization strategy: Are you replacing an existing tool or implementing your first enterprise platform? Will visualization be embedded in products you sell to customers, or is this purely for internal analytics? Do you need to support thousands of users or dozens? These strategic decisions fundamentally change which vendors are appropriate and how they should propose solutions.
Define specific personas with their needs:
- Data analysts: Need to build complex visualizations, write custom SQL or expressions, blend multiple data sources, and create reusable templates. Specify the expected number of analysts and their technical sophistication.
- Business users: Must filter and explore existing dashboards without assistance, export data for further analysis, and create simple visualizations from approved data sources. Indicate volume and technical comfort level.
- Executives: Primarily consume dashboards on mobile devices, need instant load times, require executive-level visual polish, and expect self-service access without training. Specify how many executives and their device preferences.
- Sales teams: If sales teams will use visualizations for client presentations or pipeline analysis, specify whether they need mobile access, offline capabilities, or the ability to create custom views for prospect meetings.
For each persona, quantify expected users and growth projections. This information drives pricing discussions and helps vendors propose appropriate licensing models. A tool that works for 50 users often collapses economically or technically at 5,000 users.
Document your data ecosystem comprehensively:
- Primary data sources: List each system that feeds visualizations (data warehouses, databases, cloud applications, SaaS platforms). Include versions, hosting locations (cloud, on-premise, hybrid), connection methods, and any access limitations. If your organization uses enterprise search capabilities to locate information across distributed systems, consider how visualization tools will integrate with those discovery mechanisms.
- Data volumes and performance requirements: Specify total record counts, typical query datasets, and acceptable latency. If your largest dashboard queries 50 million records and must return results in under 3 seconds, state that requirement explicitly.
- Data preparation needs: Will your data team handle all transformation upstream, or do you need the visualization tool to support joins, calculations, and data blending? Specify the complexity of transformations required.
Visualization and dashboard requirements
Move beyond generic "we need charts and graphs" to specify the actual visualization capabilities your use cases demand. This section reveals whether vendors can support your analytical needs.
- Essential visualization types: List the specific charts, graphs, and visualizations your team uses regularly. Include both standard types (bar, line, scatter) and specialized visualizations (sankey diagrams, geographic maps, network graphs). If your industry uses specific visualization conventions, mention those.
- Dashboard complexity: Describe your most complex dashboard. Does it combine 30 visualizations with interdependent filters? Does it need to refresh every 5 minutes while maintaining sub-second response? Does it serve 10,000 concurrent users? These edge cases reveal limitations of the tool that won't appear during simple demos.
- Branding and customization: Detail branding requirements for embedded visualizations. Can you apply custom themes, colors, fonts, and logos? Can you remove vendor branding entirely for customer-facing deployments? These capabilities vary dramatically between tools.
Deployment and integration requirements
How you'll deploy visualizations shapes technology selection as much as features do. Be explicit about integration needs, hosting preferences, and embedding requirements.
- Hosting model: Specify whether you need cloud-hosted SaaS, on-premises deployment, or a hybrid option. Include reasons if you have strong preferences, regulatory requirements, data sovereignty concerns, or IT policies that mandate specific hosting models.
- Embedding requirements: If you'll embed visualizations in internal applications or external portals, detail the technical approach. Will you use iframes, JavaScript SDKs, or API-based rendering? Must embedded dashboards support single sign-on? Can you white-label completely?
- Development and customization: Clarify whether your team will need to extend the platform through custom code. Some vendors offer JavaScript APIs enabling deep customization; others provide closed systems. If developers will build custom visualizations or integrate with your application stack, confirm vendors support this extensibility.
Critical questions that reveal true vendor capabilities
Beyond requirements sections, your RFP should pose specific questions that expose whether vendors can actually deliver what they claim. These questions move past marketing language to uncover real capabilities, limitations, and implementation realities.
Performance and scalability questions
Performance problems destroy visualization tool adoption faster than missing features. These questions verify vendors can handle your actual data volumes and user loads.
- "Describe your largest customer deployment by data volume, concurrent users, and dashboard complexity. What performance do they experience?" This question reveals whether vendors have experience at your scale. If they haven't successfully deployed at your size, you'll face implementation risks they haven't solved.
- "What specific performance optimization techniques does your platform use for large datasets?" Look for answers about data caching, query optimization, incremental refresh, aggregation strategies, and columnar storage. Vague responses about "advanced algorithms" signal vendors who haven't solved performance at scale.
- "Can you demonstrate your tool with our actual data volumes?" Request proof-of-concept testing with realistic data sizes, not the sanitized demo datasets vendors usually show. This testing exposes performance issues before you commit to implementation.
- "What happens when query performance degrades? How do users experience slowness, and what tools do administrators have to diagnose and resolve issues?" You need visibility into performance problems and capabilities to fix them without vendor support for every issue.
User adoption and usability questions
The most powerful tool fails if users won't adopt it. These questions assess whether each persona in your organization can effectively use the platform.
- "Walk us through how a non-technical business user would create a simple chart from existing data. What steps are involved?" Have vendors demonstrate this process, ideally during presentations. If creating a basic bar chart requires 15 steps, your business users won't adopt the tool.
- "What training does your typical customer provide to different user types? How long until users are productive?" Compare answers across vendors. If one requires 2 days of training while another needs 2 weeks, that gap signals usability differences.
- "How do you handle the tension between power user capabilities and business user simplicity?" The best tools provide both without compromising either. Watch for vendors who assume all users are either highly technical or completely non-technical—most organizations need both.
- "What's your customer adoption rate? What percentage of licensed users actively use the platform monthly?" Low adoption rates indicate usability issues, poor performance, or feature gaps that drive users back to familiar tools like Excel.
Implementation and support questions
Implementation complexity and ongoing support determine whether you'll realize value from your investment. These questions uncover what deployment actually requires and what happens when issues arise.
- "Describe a typical implementation timeline for an organization of our size. What are the key milestones, and what resources do we need to provide?" Vendors often underestimate implementation timelines in proposals. Press for realistic schedules based on comparable deployments.
- "What technical expertise does your implementation team provide? Will we work directly with presales and solutions teams who understand our industry and technical environment?" The quality of implementation support often determines project success more than the tool's features.
- "What's the most common implementation challenge your customers face, and how do you help them overcome it?" This question reveals problems you'll likely encounter and whether vendors have solutions or just acknowledge difficulties exist.
- "What's your support model? What response times can we expect for critical issues versus enhancement requests?" Understand support coverage (business hours versus 24/7), response time SLAs by severity level, and escalation processes before problems arise.
- "How do you handle version upgrades? How often do you release new versions, and what's involved in upgrading?" Frequent mandatory upgrades disrupt operations. Understand upgrade frequency, testing requirements, and whether you can defer upgrades if needed.
Pricing and total cost questions
Pricing for a visualization tool often hides costs that only emerge at scale. These questions expose the total cost of ownership beyond initial license fees.
- "Provide complete pricing for our expected user count in year 1, year 2, and year 3, assuming 30% annual growth. Include all license types, connector fees, and usage-based charges." This projection reveals scaling costs that may not be obvious in initial quotes.
- "What's included in base licensing versus paid add-ons?" Some vendors charge separately for mobile access, embedded analytics, premium connectors, advanced visualizations, or API access. List every feature you need and confirm it's included in the quoted pricing.
- "What professional services are typically required beyond initial implementation? What do customers usually need help with in years 2 and 3?" Budget for ongoing consulting, optimization, and custom development that many deployments require.
- "How does pricing change if we need to add external viewer access for customers or partners?" Viewer pricing models vary dramatically. Some vendors charge per named viewer; others use anonymous viewer pricing; some offer unlimited viewing. Understand models upfront if you'll embed analytics externally.
Common pitfalls in data visualization RFPs
Even thoughtful RFPs can derail procurement if they fall into these common traps. Recognizing these pitfalls helps you avoid them and improve vendor selection outcomes.
1. Overemphasizing features while ignoring user experience
The longest feature list rarely correlates with the highest user adoption. Teams often create exhaustive feature matrices comparing hundreds of capabilities across vendors, then select the tool with the most checkmarks. This approach misses that tools with 95% feature coverage but excellent usability often succeed, while tools with 100% coverage but poor user experience fail.
Better approach: Require vendors to demonstrate actual workflows during presentations. Watch how many clicks it takes to complete common tasks. Ask non-technical stakeholders to try building a simple visualization during vendor demos. User experience differences become obvious through hands-on testing that feature checklists never reveal.
2. Neglecting data preparation and governance
Many organizations focus RFPs entirely on visualization capabilities while treating data preparation and governance as afterthoughts. Then they discover that the tool requires extensive data modeling, their team lacks expertise in, or that governance controls can't enforce the security policies they need.
Better approach: Dedicate RFP sections to data preparation workflows, security models, and governance capabilities. Ask vendors to explain how business users access data without compromising security. Verify the tool supports your data modeling approach, whether that's dimensional modeling, denormalized tables, or semantic layers.
3. Testing with unrealistic demo data
Vendor demos use perfectly prepared datasets specifically designed to make their tools look great. Small datasets load instantly, clean data produces beautiful visualizations, and every feature works flawlessly. These demos reveal nothing about how tools perform with your messy, voluminous, real-world data.
Better approach: Require finalists to conduct proof-of-concept testing with your actual data. Provide sanitized samples reflecting real data volumes, quality issues, and structure. Test your most complex dashboard requirements, not the simplest ones. Performance and usability problems that demo data hides often emerge immediately with production data.
Underestimating mobile and embedded requirements
Teams often treat mobile access and embedded analytics as nice-to-have features during RFP evaluation, only to discover these capabilities are business-critical after implementation begins. By then, they're locked into tools with weak mobile experiences or embedding limitations that can't be fixed.
Ignoring vendor support quality
Organizations focus on features and pricing during RFP evaluation, assuming support quality is roughly equivalent across vendors. Then they encounter critical issues and discover that their vendor provides slow, unhelpful support, leaving them stuck for weeks while operations suffer.
- Better approach: Call references and ask specifically about support experiences. How quickly do they get responses? Do support engineers actually solve problems or just collect information? Can they reach vendor product teams when needed? Good support often matters more than feature advantages when production systems fail.
Evaluating vendor responses effectively
After vendors submit responses, systematic evaluation ensures you compare proposals objectively and select the best fit for your organization. These practices help you move from responses to confident decisions.
Create a weighted evaluation matrix before receiving proposals
Define evaluation criteria and weights before vendors respond. This prevents bias in adjusting the criteria to favor a preferred vendor after reviewing proposals.
Common evaluation categories for visualization tools include:
- Technical capabilities (25%): Data connectivity, visualization types, performance, scalability.
- Usability for all personas (25%): Ease of dashboard creation, exploration, and administration.
- Total cost of ownership (20%): Initial licensing, implementation, ongoing costs, and hidden fees.
- Vendor strength (15%): Company stability, customer references, support quality
- Implementation and support (15%): Timeline, resource requirements, support model, training.
Adjust weights based on your priorities. If you're replacing a tool because users hate it, prioritize usability. If you're embedding analytics into the products you sell, weigh technical capabilities and customization more heavily. Let your strategic objectives drive evaluation criteria rather than using generic weights.
Score proposals independently before team discussion
Have each evaluation team member score all proposals independently using your established criteria before discussing as a group. This prevents groupthink and ensures diverse perspectives are considered.
When team members' scores diverge significantly, those differences often reveal important considerations. A data engineer might weigh technical architecture heavily, while a business leader focuses on user adoption potential. These discussions improve decision quality by surfacing different perspectives rather than converging prematurely on a single view.
Look beyond polished presentations
Vendor presentations showcase their tools in the best light with perfect demos and compelling stories. While presentations matter, they shouldn't dominate evaluation. Remember that impressive proposals don't guarantee implementation success—focus on product capabilities, not presentation polish.
Supplement presentations with:
- Hands-on proof of concepts: Give team members direct access to test environments. Let them try building visualizations, exploring data, and experiencing the tool without vendor guidance.
- Reference calls with peers: Ask references about their actual experiences, not scripted success stories. What surprised them negatively? What would they do differently? Would they choose the same vendor again?
- Technical deep dives: Have your technical team meet with vendor architects to discuss architecture, integration approaches, security models, and implementation details that presentations gloss over.
The best presentations come from sales teams skilled at storytelling, not necessarily from vendors with the best products. Balance compelling narratives with objective evidence from testing, references, and technical evaluation.
What to expect from vendors during the RFP process
Understanding normal vendor behavior during RFPs helps you interpret responses and interactions appropriately. These insights help you distinguish between reasonable questions and red flags.
- Vendors will ask clarifying questions: Even comprehensive RFPs generate questions. Establish a formal question-and-answer period where vendors submit questions by a deadline, and you publish anonymized answers to all participants. This ensures fair treatment while helping you clarify ambiguous requirements.
- Proposals will vary in format despite your instructions: Some vendors follow your structure exactly, while others reorganize the content to tell their story. Vendors with experienced bid and proposal teams typically deliver more comprehensive responses. As long as they address all required sections, format variations don't indicate problems. Focus on substance over adherence to your template.
- Response timelines affect proposal quality: Giving vendors two weeks to respond to complex RFPs often produces superior proposals compared to one-week deadlines. Quality vendors invest significant resources in proposals, and sufficient time enables them to assemble technical teams, develop customized demos, and provide thoughtful responses rather than rushed submissions.
Creating RFPs that lead to successful implementations
Choosing a data visualization tool directly impacts decision-making, performance tracking, and business outcomes. A well-structured RFP helps clarify requirements, objectively compare vendors, and identify potential risks early.
The success of an RFP depends on how specific it is. Generic RFPs receive broad, unfocused responses, while detailed RFPs outlining user needs, data scale, performance expectations, and deployment preferences attract more relevant vendor proposals. Investing time in building strong RFPs simplifies implementation and reduces long-term challenges.
Beyond vendor selection, RFPs help teams align internally, identify requirement gaps, and create clear success benchmarks. Organizations should focus on tools that best match their core use cases and support personalized user experiences. Selecting the right vendor also means choosing a long-term partner who can support evolving business and implementation needs.